How does this fit to Amazon Machine Learning?
The most prominent use case provided by Amazon in their tutorial is a human decision-making process, based on a set of categorizations. The general idea with it is based on these characteristics, a binary decision (such as “will buy a product or not”) is being made. Machine learning shall support (based on a probabilistic approach) the identification of people with buying-will.
In the scenario depicted above, we are simulating that kind of decision: The three variables a, b, and c represent three characteristics based on which a decision could be taken. The decision itself is represented by the target value. Due to the fact that the formula used above always yields the same result, the decision-making process can be considered 100% rational.
Generation of Input Data
Machine learning models require a set of data, which can be used for the learning process. Typically, the number of records for such training data is in the order of thousands (if not millions, cf. Big Data). As the scenario should stay clear, we will only provide a little redundancy to the model. That is why for each combination for each variable ranging from 1 to 7 the corresponding result and the target value is being computed. Note though, that some values with a = 1 and a = 2 are left out (we will come to that a little later). Yet, the number of records are not sufficient yet. That is why the same block of records (with exactly the same values) are being repeated five times. Also note that the (intermediate) result is not part of the input data for the ML model (as this would be too easy). You may find the resulting input file for your reference attached to this post.
 input-data-for-amazon-ml.csv (1.9 KiB, 690 hits)
Generating the Machine Learning Model
Equipped with the input data as depicted above, we may proceed now with generating the ML Datasource and the ML model, very similarly as described in Amazon’s official tutorial. On creating the datasource, Amazon visualizes the data distribution of the binary target attribute by stating (descriptively) that there are 29 falsy observations and only 11 truthy observations in the data set. As already stated above, automatically, the first 70% of the data is being used for the learning process; the other 30% is being used to assess the learning quality.
After less than 10 minutes processing (wall clock) time, the services returns a model, whose AUC (area under curve) is 1.000, which indicates a “perfect, not-improvable” quality. This superior result is also clearly visible in the “ML model performance analysis”, which Amazon visualizes for this model (the perfect match is indicated by the fact that the two curves do not overlap at all):
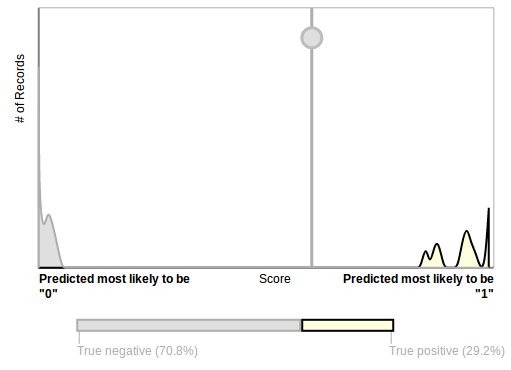
ML model performance Analysis
It is based on the fact that we have created a repetitive set tuples as input data. Due to the 70:30 ratio, the evaluation was based on exactly the same values with which the model was trained before. Therefore, setting the score threshold is quite arbitrary. To be identifiable, we will set it to 0.6.
Querying some sample values like a = 3, b = 3, c = 3, and a = 4, b = 4, c = 4 return the expected result. It seems that Amazon’s machine learning did the trick and has “learned” what can be learned…
Looking a bit closer
All this so far looked like that the machine is able to master mathematical computations like nothing: Also conducting a test of all 40 values, which we made available with the input data, showed that the expected result is equal to the actual result (i.e. the model responded truthy, if the input data was truthy and the model responded falsy, if the input data indicated that the target value was falsy).
However, “learning” is not just the activity of reproducing memorized information – the technique of memoization is already known to computer science for decades (it came up in the late 1960s) and may be easily made persistent in a relation database management system. Instead, the most important effect is the capability to transfer the learned. That is where the missed records mentioned above kick in: Note that, for example, we did not provide the target value a = 1, b = 2, c = 2 in the input data! So, querying for that tuple (and such alike) might give an indication on how strong the “real learning effect” really is. See yourself:
| a | b | c | intermediate result | expected target | actual target | reported score |
|---|---|---|---|---|---|---|
| 1 | 2 | 2 | 0 | false | false | 0.328229159116745 |
| 1 | 2 | 3 | 16 | true | false | 0.0001738734426908195 |
| 2 | 1 | 3 | 16 | true | false | 0.0001329469378106296 |
The result is not very appealing: Though the response for a = 1, b = 2, c = 2 is correct, confidence from the model (the score value) could be higher. Moreover, the other two results provided are simply wrong – and also the model appears to know that (see the low score values)!
An even more interesting result is provided as soon as we leave the pre-defined range for a, b, and c between 1 and 7:
| a | b | c | intermediate result | expected target | actual target |
|---|---|---|---|---|---|
| 8 | 8 | 8 | 5 | false | false |
| 8 | 8 | 9 | 4 | false | false |
| 8 | 9 | 8 | 13 | true | false |
| 12 | 12 | 12 | 13 | true | false |
| 44 | 1 | 1 | 9 | false | false |
| 45 | 1 | 1 | 10 | true | false |
| 1 | 1 | 18 | 0 | false | false |
| 1 | 1 | 19 | 16 | true | false |
The table above gives an indication to another effect: Observe that for each tuple, where at least one value is used, which is out of the initial range, the target value false is returned! This observation can also be verified with all tuples having the following patterns:
- (x,x,x) whereas 8 <= x <= 50
- (1,1,x) whereas 8 <= x <= 50
- (x,1,1) whereas 8 <= x <= 50
Given the initial data analysis observation that in the training data, there are more falsy values than truthy one’s, defaulting to the value false seems reasonable. However, I would not dare to call “defaulting to a single value whose probability is the highest” to be the same as “learning”.
Descriptive Analysis of Predictions
A complete list of all predictions made by the ML model with (x,y,z), whereas each variable ranges from 1 to 10, can be downloaded here:
amazon-ml-predictions-st0.6.csv (32.4 KiB, 691 hits)
Removing all records which were already part of the input data, you will observe the following statistical facts:
- 420 out of 961 records have been predicted wrongly; vice versa, 541 records have been predicted properly. This is a “hit ratio” of 56.3%. Note that it is close but not equal to the score threshold.
- Guessing based on the modulo which we have provided, the expectation for always defaulting to false is 9/17, or 52.9%. Thus, the advantage of the ML model is 3.4%.
- In the input data, however, we have a biased data set, which indicates a probability of 29/40 (or 72.5%) in favor of the value false.
- Out of the 420 wrong answers
- 102 are false negatives,
- 318 are false positives,
- 150 answers had a score of 0.05 or higher,
- 57 answers even had a score of 0.95 or higher suggesting a very high confidence.
Sensitivity Analysis
To determine the influence of the score threshold, the entire analysis depicted above has been repeated with a deviating score threshold of 0.1. The corresponding result is documented in the following file:
amazon-ml-predictions-st0.1.csv (32.5 KiB, 731 hits)
Looking at the data there, you may observe:
- All predictions whose record was already available in the input data, is answered correctly.
- 472 out of 961 records have been predicted wrongly
- vice versa, 489 records have been predicted properly.
- This is a “hit ratio” of 50.9%. Note that this is close to the probability of flipping a (fair) coin.
If this was a test performed with humans, you could suspect that the test person was guessing non-biased and randomly.
The resulting histogram of the scores provided is shown in the following diagram:
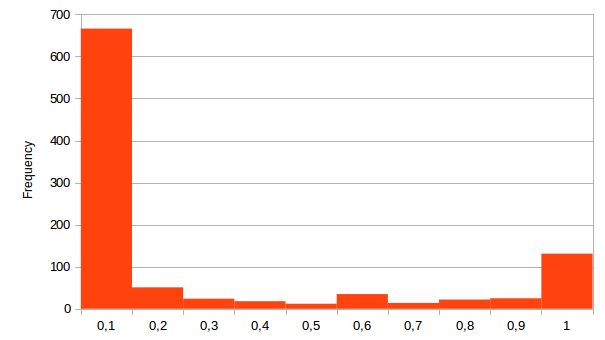
Histogram of scores values
Conclusion
This small analysis has shown that the default configuration of the Amazon Machine Learning service is capable of memo(r)izing simple mathematically-computed values. However, the term “to learn” is understood differently in the streets: Speakers associate with it a certain degree of capability to transfer knowledge gained previously to a different but similar case afterwards. The small test vectors depicted above do not indicate that the Amazon Machine Learning service is capable to do so based on a test using a simple mathematical correlation.
Limitations
The analysis depicted in this post is only a spot check. Various reasons may exists, why your test may provide different results. Amongst these are:
- Amazon might have changed the service to provide better results without notification.
- Your dataset might suite better to Amazon’s algorithm.
- The set up of this test might be biased in such a way that Amazon could not handle the results better.
- The execution of the scenario might have been faulty.
- This is only a one-time execution of the scenario; multiple executions of this test may provide deviating results, as the ML model derivation consists of drawing at least one random number.